Highlights from European Journals
Representing Complex Network Structure Through Relational Quasi-Equivalence Classes
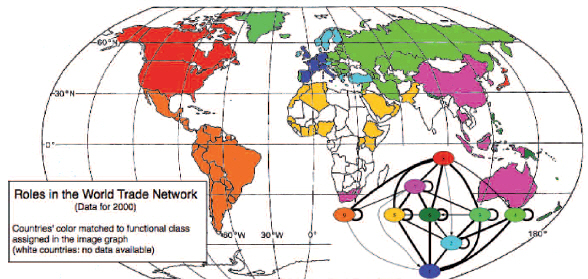
The functional roles played by interactive agents lead to specific patterns in the link structure of their interaction network. Understanding complex multi-agent systems from the social life, or biosciences requires understanding of the complex topology of the underlying network. To identify sets of roleequivalent agents we combine ideas from spin glass physics and social network analysis to develop a framework for automatically decomposing (‘’block-modeling’’) the functional classes of agents in a (multi-relational) network. The functional classes and their patterns of connectivity are represented in a resulting image graph, depicting a large network as a small one in a quasi isomorphic way. Our cost function finds the optimal image graph and simultaneously maps agents into functional classes. The method handles directed and undirected two- and onemode data, weighted networks, finds an optimal number of roles, and is computationally efficient and nonparametric. Applied to the world trade network, countries are grouped into classes with similar commodity bundles of trade relations with others. The image graph shows preferred links where the trade volume exceeds the expectation value given countries’ total import and export volume.
J. Reichardt and D. R. White, “RoleModels for ComplexNetworks”Eur. Phys. J.B,60,217(2007).