RNA-seq Transcriptome Analysis Beispiel
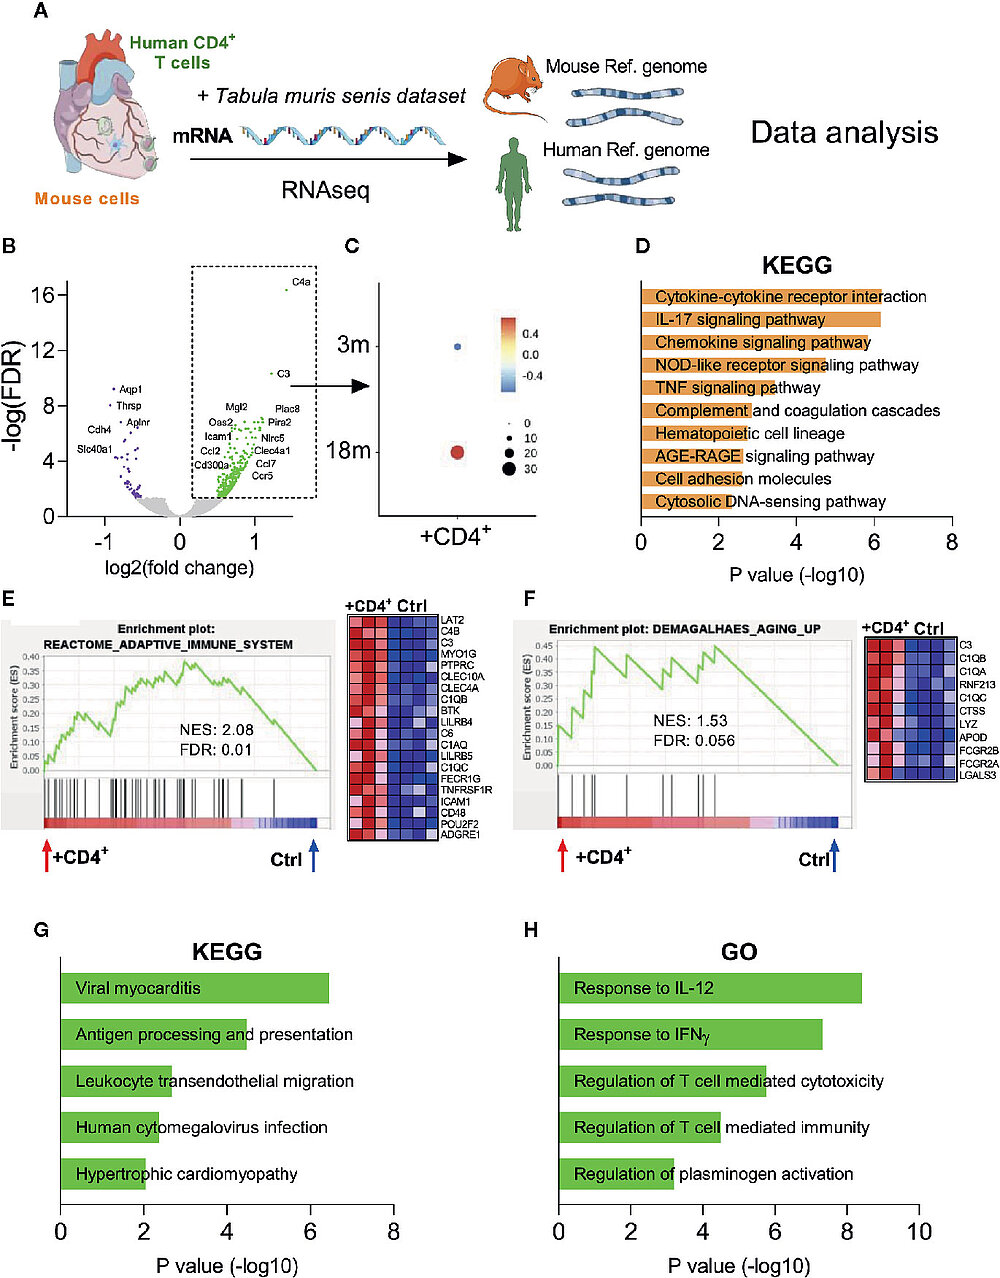
Transcriptome analysis reveal an inflammaging phenotype in the heart of CD4+ T cell transferred NSG mice.
(A) Myocardial mRNA extracted from control and T cell transferred NSG-DR1 mice was employed in RNA-seq analysis. Transcripts were aligned against mouse genome and human genes were selected using the XenofilteR tool and further integrated with other publicly available datasets. (B) Volcano plots comparing the gene expression levels in myocardial tissue of T cell transferred NSG-DR1 mice versus control. The upregulated and downregulated genes (± 0.5–1.5 log2 fold, FDR<0.05) are highlighted in green and purple respectively. (C) The myocardial upregulated gene set identified in (B) was then probed in other myocardial aging datasets publicly available [Tabula muris senis (19)]. A score of the average expression levels (colored scale) and fraction of cells expressing the signature (circle sizes) was analyzed at single-cell level on myocardial samples obtained from 3- and 18-months old mice (3M and 18M respectively). (D) KEGG analysis of upregulated mouse transcripts from T cell transferred NSG-DR1 hearts. The bars represent the adjusted P value (Fisher’s exact test). (E, F) GSEA analysis of “reactome adaptive immune system” and “Demagalhaes aging up” (36) in the myocardium of control and T cell transferred NSG-DR1 mice. Normalized enrichment score (NES) and FDR are depicted in the graphs. The heatmaps illustrate the genes differently expressed at each gene set. (G, H) KEGG and gene ontology (GO) analysis of upregulated human transcripts found in the myocardium of T cell transferred NSG-DR1 mice. The bars represent the adjusted P value (Fisher’s exact test). Data from control (n: 4) and CD4+ T cell transferred (n: 3) were acquired from two independent experiments. See original publication.